Data-Analysis Exercise
Introducing/Doing Data
Analysis with the Multilevel Model for Change
(ALDA,
Chapters 3 & 4, pp. 45-137)
Purpose of the Exercise
This data-analytic exercise supplements our presentation that introduced, and described data analyses with, the Multilevel Model for Change. The immediate purpose of the exercise is to “open the door” to your implementation of multilevel modeling with SAS PROC MIXED, by asking you to program and execute a series of statistical analyses that replicate, and extend, the core material contained in ALDA and featured in our presentation.
General Resources for Conducting the Exercise
While we provide self-contained instructions below for conducting the exercise, we recommend that you keep the following resources close at hand:
· ALDA itself, and the handouts from our presentation.
· The UCLA Academic Technology Services website that supports ALDA, at http://www.ats.ucla.edu/stat/examples/alda/ . This site contains downloadable versions of the datasets used in ALDA, specimen computer programs (in HLM, MLwiN, S+, SAS, SPSS, Stata) and sample computer output for all exhibits in the book, using each of the software programs.
Datasets
The dataset used in this exercise was formatted by UCLA Academic Technology Services and is available for download, as text and system files from their website. For our current purposes, the dataset has already been downloaded onto your workstation and stored in a directory on the hard drive. You will need to know the address of this directory in order to conduct the analyses below.
Data-Analysis Exercise
Please proceed sequentially through the requested tasks:
1. In this exercise, you will use the data on adolescent alcohol use featured in ALDA Figure 4.1, page 77 ff., and in our presentation. Please have this exhibit close at hand.
2. The files that contain the various incarnations of these data have the prefix alcohol1. They appear in the data directory several times with different suffixes denoting different versions of the file -- as raw text and as system files appropriate for analyses with the different software packages.
a. Examine the raw text person-period dataset, called alcohol1_pp.txt, by opening Windows Explorer and clicking on the filename in the appropriate data directory on your hard drive. Windows Notepad should then display the contents of the file. Make sure that the first four lines of the dataset match the following:
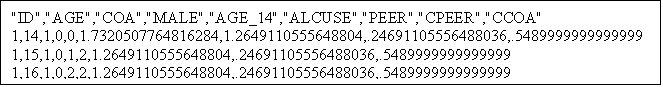
b. Notice that the person-period data-file contains comma-delimited text, with a first line containing the variable names, in quotes: ID, AGE, COA, MALE, AGE_14, ALCUSE, PEER, CPEER, CCOA. For the moment, we focus only on ID thru ALCUSE. By consulting ALDA, match these variable names with the variable descriptions on pp. 76 ff. Make sure that you can line up the names of the variables with their values for the first case, across all the three waves of his data, and that you understand why they take on the values that they do:
i. Notice that variable AGE_14 is simply a re-centered version of adolescent AGE, obtained by subtracting 14 (years) from latter variable’s values. The re-centered version is used in subsequent analyses, as described in ALDA.
ii. Recall that ALCUSE is actually the square root of the mean of participant’s responses across several items on the alcohol use questionnaire (as described on p. 76). You can see the effect of this transformation most clearly by examining the ALCUSE value for the third adolescent (ID = 3) at age-16.
3. Boot up PC-SAS on your workstation, by clicking on the appropriate program icon or filename.
a. You will see the SAS opening screen that usually, by default, contains the SAS Explorer, Editor, Log and Output windows (the Output window may be hidden behind other windows). These windows can be opened by using the VIEW menu in the upper toolbar or by clicking on the labeled tabs in the lower toolbar.
i. Use the Editor window to compose your SAS program code.
ii. Your output will appear in the Output window.
iii. Your job log will appear in the Log window.
b. If there is currently any content present in the Editor, Log or Output windows, clear it by going to that window and selecting Edit>Clear All on the upper tool bar or on the menu that pops up when you click the right mouse button.
c. Although SAS can accept data entry in all kinds of formats, we will be using data in the form of SAS system files in this data-analysis exercise. This has the advantage of streamlining the entry of the data along with the corresponding variable names, etc.
4. Begin your analyses of the alcohol1 dataset using SAS.
a. Read the alcohol1 person-period system file (alcohol1_pp.sas7dat) into SAS, and obtain univariate descriptive statistics on selected variables, by typing the following code into the SAS Editor:
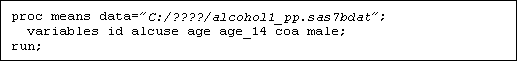
b. Where you must replace the filename within the quotes on the first line of the program to identify the home of the alcohol1 person-period SAS system file on your own computer.
i. In SAS, “proc” calls on a particular “procedure” for execution, in this case the “means” procedure is asked to compute univariate descriptive statistics for several variables across the entire person-period dataset (note that the obtained statistics may not be meaningful as they collapse the data across both occasions and persons).
ii. After the “proc” sentence, there are usually additional sentences. In this example, within the “means” procedure, we are asking for descriptive statistics on “variables” ID, ALCUSE, AGE, AGE_14, COA, MALE. Notice how the order in which you list these variables determines the order of the summary statistics in the output.
iii. Careful:
1. It doesn’t matter whether you use upper or lower case text in your program.
2. It doesn’t matter where you insert spaces, nor how many.
3. But, you must end each “sentence” with a semicolon, otherwise disaster – omitting the semicolon is the most common error in SAS programming.
c. To execute your program, click on the small “running man” icon on the upper tool bar in SAS or select Run>Submit.
i. In the unlikely event that you have not made any programming errors (a free weekend in Yorkshire to anyone who gets it right the first time, two free weekends to the next person!!!), output from your analyses should appear in the SAS Output window. You can move among the windows by using the tabs in the lower toolbar.
ii. If you have made errors (and who doesn’t – look at us!), you will find diagnostic messages in the Log window that may help you to fix the error (it depends on whether they are written in Martian, or not!).
1. Edit your program, in the Editor window, and re-run.
2. If that doesn’t work, “clear all” and start again.
3. If that doesn’t work, scream loudly and put your foot through the screen for relief. Then, run.
d. Once you have successfully obtained output (the workshop could end right here?), print it out for your records.
e. Now modify your SAS program to obtain empirical growth plots of ALCUSE vs. AGE for the top four cases in Figure 4.1 (ID’s 4, 14, 23, 32). You can do this by editing your code in the SAS Editor, to read:
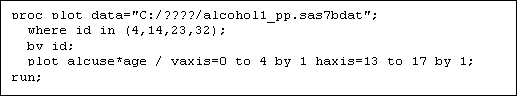
f. Where you again must replace the filename within the quotes on the first line of the program to identify the home of the alcohol1 person-period SAS system file on your own computer.
i. The “plot” procedure generates rudimentary plots (for publication quality plots, you must use “proc gplot,” of which there are examples of programs on the UCLA site.
ii. After the “proc” sentence, we have included a “where” command, which selects the data for the four cases – ID’s 4, 14, 23, 32 – for plotting. If this command were omitted, plots would be generated for every case in the dataset (86 pages of output – it’s your call).
iii. Notice that the procedure is executed “by id,” which means that the command “plot” is executed separately for each case (as distinguished by the value of id). (Normally, before executing a command like “by id”, you need to sort the data using “proc sort; by id” – in this case, however, you do not need to sort because the dataset is already sorted by id, in the data file itself).
iv. The fourth line of the code (“plot”) – which contains details of the required plots – specifies that ALCUSE (the first named variable is plotted on the Y-axis) be plotted against AGE (on the X-axis). After the slash (“/”) on this line, we have specified options to scale the vertical and horizontal axes so that they run from 0 to 4, and 13 to 17, in units of 1, respectively). These options are not required and could be removed, including the slash itself – try it and see what happens.
5. At this point in the exercise, prepare to fit your first multilevel model for change in order to investigate the relationship between an adolescent’s change in alcohol use and whether they are the “child of an alcoholic” (COA). First, you need to make sure that you are facile with the transition between the level-1/level-2 and composite specifications of the multilevel model. This is important because most software (including SAS PROC MIXED) uses the composite specification in the creation of code.
a. On a sheet of paper, write down the L1/L2 specification in Equations (4.1) and (4.2) on pp. 77-78 of ALDA, and perform the required substitutions for the individual growth parameters from the level-2 model into the level-1 model in order to obtain the composite specification. Separate out the structural (“fixed”) and stochastic (“random”) portions of the model, as we have done in the book and presentation. Compare what you obtain with the composite specification in Equation (4.3) on p. 81. (We recommend that you actually perform this substitution yourself, rather than just reading the derivation in ALDA, because the sooner you begin to work actively with the two model formulations, the easier you will find it to plan and execute your own analyses in the future). Notice that:
i. The structural portion of the composite model contains four fixed effects corresponding to the main effects of the TIME and COA predictors, their interaction COA×TIME, and also an intercept.
ii. The stochastic portion of the composite model contains three random effects: the level-1 error, the level-2 error associated with individual initial status, and the level-2 error associated with the individual rate of change (multiplied by TIME).
iii. In order to fit the hypothesized model appropriately, you must specify all these features to SAS PROC MIXED.
b. Now fit the multilevel model for change to the alcohol1 data. This first model will replicate Model C in Table 4.1, on p. 94/5 of ALDA.
i. Begin, by “clearing all” from the Editor and the Log, and deleting the output files from the SAS Explorer window if you wish. Then, type the following new program into the SAS Editor:
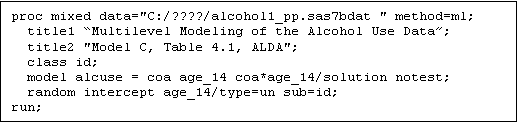
ii. In SAS, multilevel modeling is conducted using “proc mixed” (for “mixed models”) in the person-period dataset:
1. The “proc mixed” sentence calls up the routine, identifies the dataset and specifies the method of estimation (“ml” = full maximum likelihood, the default is restricted ML)
2. The two “title” lines are optional, and serve to add the specified material in quotes to the top of each output page as titles. They can be inserted in any other procedure, too.
3. The “class” statement lets the routine know that “id” is a classification (or categorical) variable. This variable then returns later (in the “random statement”) to identify subjects.
4. The “model” statement records your hypotheses about the fixed effects. The outcome, ALCUSE, is listed on the left of the “=” sign and the predictor variables (COA, AGE_14, and the interaction COA*AGE_14) are listed to the right of the “=” sign.
a. The intercept is assumed to be present, and so does not need to be specified.
b. Interaction terms do not need to be created in advance and will be constructed by the computer during processing (will wonders never cease?), provided you indicate them as above.
c. The options in the model statement, after the slash (“/”), ask that a “solution” be given for the fixed effects (i.e., you are stating that you want to see the estimates of the fixed effects) and that you want to eliminate certain special testing (“notest”). (Try eliminating these options and see what happens).
5. The “random” statement indicates which random effects you would like to include in the composite error:
a. PROC MIXED assumes that the level-1 error will be present, and so no command is given to include it.
b. You must specify which of the level-2 residuals you want to be present using, as labels, the names of the predictors present in the level-1 model:
i. “intercept” ensures that the level-2 error for individual initial status will be present,
ii. “age_14” ensures that the level-2 error for individual rate of change will be present (and since SAS knows this is a multilevel model, it will multiply it appropriately by the TIME variable, in this case AGE_14).
c. After the slash (“/”), two options are exercised.
i. The first option “type=un” tells SAS what type of level-2 error covariance matrix you want – in this case, that you want to estimate the level-2 error variances and covariances “unstructured” – that is, unconstrained in any way (this is the usual strategy).
ii. The second option “sub=id” tells SAS that the classification variable, id, is the one that defines the grouping of occasions within “subjects.” Without this, it wouldn’t know which wave belonged to which person!
iii. Execute the program in the usual way (using the running man) and debug until you obtain output successfully.
iv. Print a copy of the output for your records and, on the output, identify and compare the following with entries for Model C in Table 4.1 on pp. 94/5. (The estimates in the ALDA chapter were obtained under IGLS with MlwiN and so the values may differ slightly).
1. The fixed effects parameter estimates, listed on the second page of the output under “Solution for the Fixed Effects”:
a. Using your knowledge of the correspondence of the L1/L2 and composite specifications, map the estimates onto their partners in the ALDA table. Please make sure that you understand why each maps onto each.
2. The random effects parameter estimates, listed at the top of the second output page under “Covariance Parameter Estimates.”
a.
“Residual” refers to the level-1 estimated residual variance, ![]() .
.
b.
“UN(1,1),” “UN(2,1)” and “UN(2,2) refer to the level-2
estimated residual variances and covariance, ![]() ,
,![]() and
and ![]() , respectively.
, respectively.
3. The deviance statistic associated with the model fit, listed as the entry for “-2 Log Likelihood” under “Fit Statistics”.
4. The AIC and BIC statistics, listed by name under “Fit Statistics.”
c. Now, refit the multilevel model for change two more times, to replicate the unconditional means model and unconditional growth model (Models A & B) in Table 4.1 on pp. 94/5. Here is the code that will do the job:
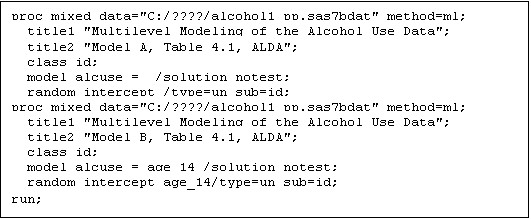
d. Execute the program in the usual way.
e. Print a copy of the output for your records and on it, identify and compare entries with Table 4.1 on pp. 94/5, under Models A and B.
i. Estimate the intra-class correlation for Model A, and compare the value to the computation on p. 96.
ii. Estimate the residual correlation between rate of change and initial status in Model B and compare the value to the computation on p. 100.
iii. Which fits better, Model B or C? How did you tell?
iv. State a null hypothesis that you could test by comparing (subtracting) the deviance statistics for Models B and C. Remember that it may contain null statements about several parameters, both fixed and random.
v. Using the difference in deviance statistics, and degrees of freedom given by a count of the number of parameters that are present in C but not in B, test your hypothesis. Do you reject it?
6. If you have any time left, take a look at the programs and output for ALDA Chapters 3 and 4 on the UCLA support site, or work on getting your own data in shape for your subsequent analyses on Friday morning.